Visualisation of Security Service targets
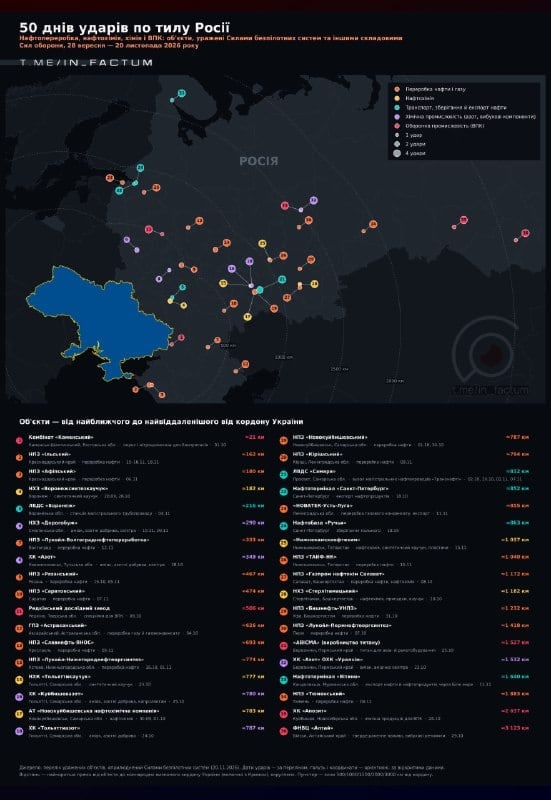
Madyar published a list of objects that came under attack by the SBU over the past 50 days. This data was transformed into a mapographic infographic, marking all items from the list.
Each target is visualised with a marker: its colour indicates the sector, while its size is proportional to the number of strikes. Below the map is a list of objects, sorted by distance from the Ukrainian border — from the nearest to the farthest.
Methodology and details
For each object, the region, a brief explanation of its functional purpose, the dates of the hits, and the distance from the border are specified.
Distances were calculated from the internationally recognised border of Ukraine, taking Crimea into account. This is why the refineries in the Krasnodar Krai are listed with a value of 160–180 km, as this is the distance to Crimea, although in fact they are further away.
Distribution by sector
Open data served as the basis for classification. The 36 hit objects are distributed as follows:
- 16 objects — oil and gas processing;
- 5 objects — petrochemistry;
- 5 objects — oil transport, storage and export;
- 5 objects — chemical industry (nitrogen, explosive components);
- 5 objects — military-industrial complex.
The coordinates on the map are approximate, with accuracy corresponding to the city or industrial zone level. However, for a general overview, this is more than sufficient.





Comments
No comments yet. Be the first!